Welcome to the Treehouse Library
This is a sample catalog of all the courses we offer. Browse by topic or difficulty. Sign up today and get access to our entire library. Treehouse students get access to workshops, bonus content, conferences, and more.
Ready to start learning?
Treehouse offers a 7 day free trial for new students. Get access to 1000s of hours of content. Learn to code, land your dream job.
Start Your Free Trial- Newest
-
All Topics
- All Topics
- • AI
- • JavaScript
- • Databases
- • Python
- • Design
- • React
- • HTML
- • CSS
- • Data Analysis
- • Java
- • C#
- • Android
- • Computer Science
- • PHP
- • Quality Assurance
- • APIs
- • Security
- • Digital Literacy
- • Development Tools
- • Business
- • 21st Century Skills
- • Ruby
- • Machine Learning
- • Learning Resources
- • Go Language
- • Equity, Diversity, and Inclusion (EDI)
Data Analysis
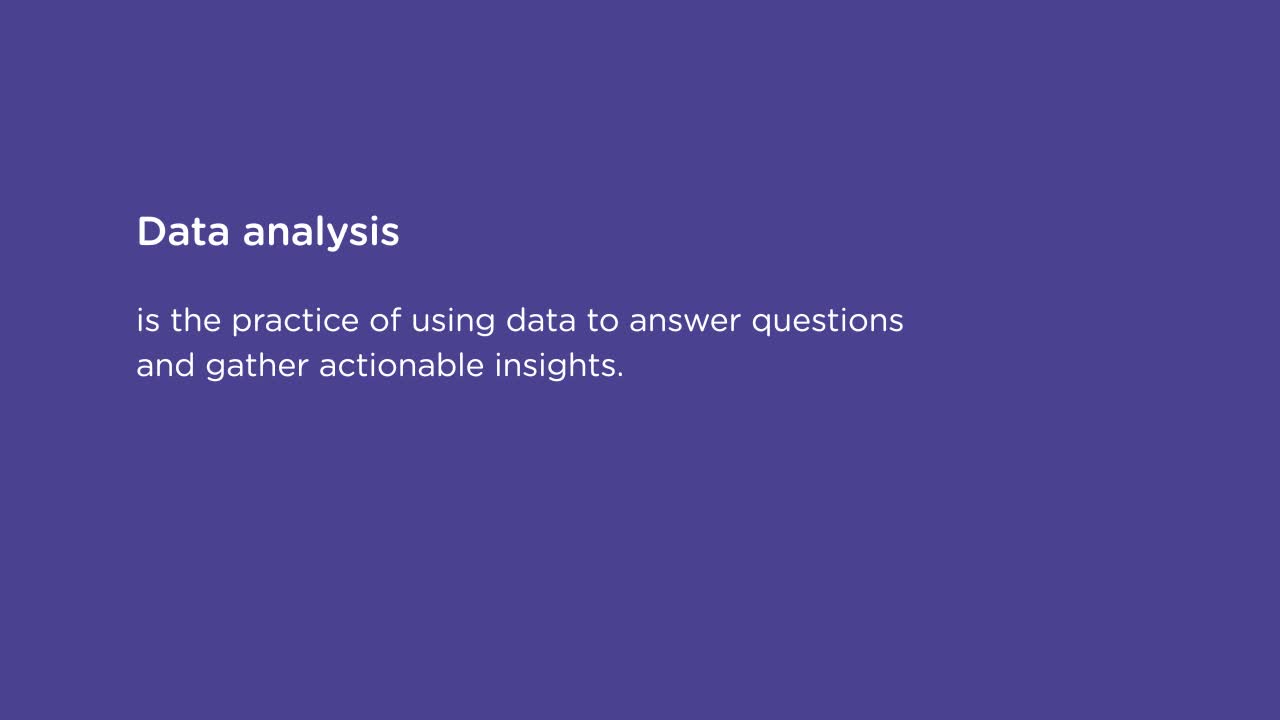
Data Analysis is a critical skill for the 21st century. The ability to collect, process and understand information helps businesses and individuals analyze previous results, predict trends and make well-informed, data-driven decisions.
-
11 minWorkshop
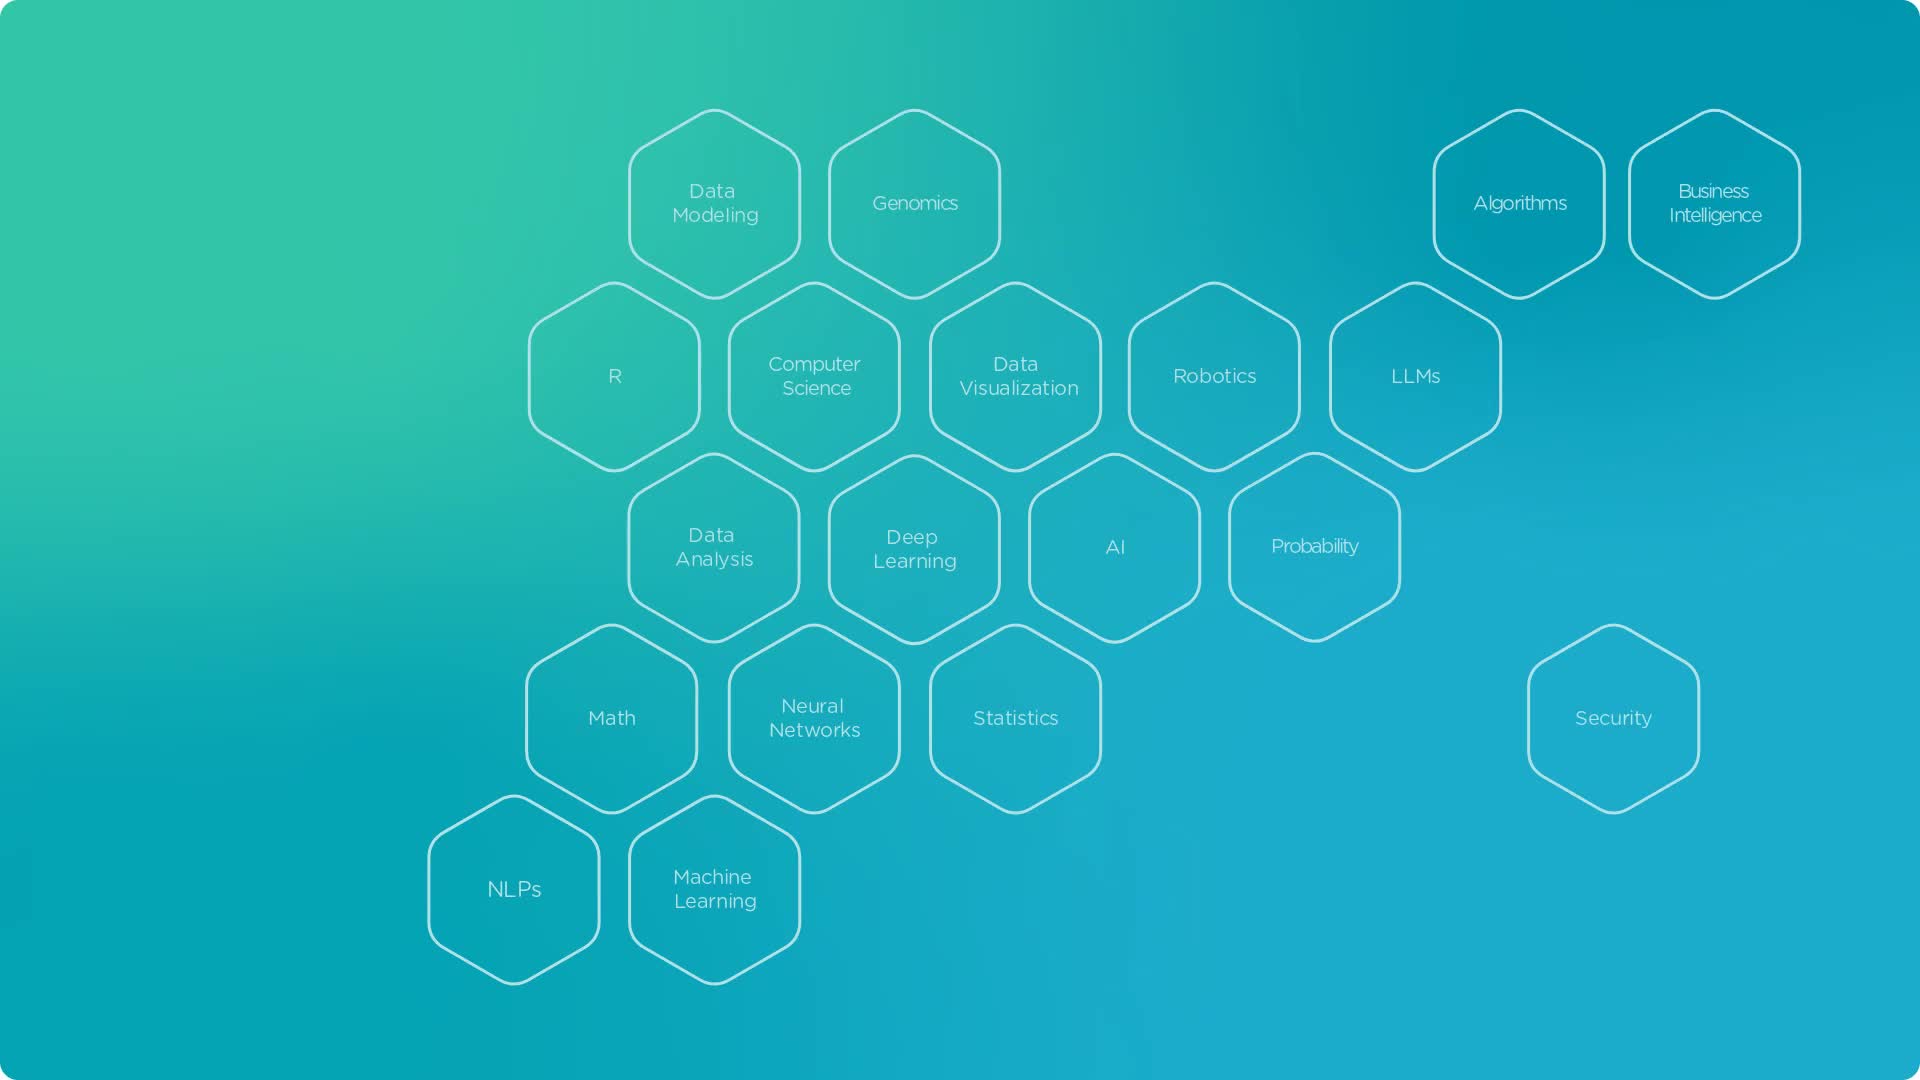
How to Learn Data Science
Data Science can seem overwhelming because of its vastness. But if you map out a learning path, acquiring the necessary skills is not a difficult task. In this video, we'll build a learning path through Data Science, starting with programming and math, moving on to machine learning and data foundations, and rounding things out with domain expertise.
Viewed -
- 1
- 2
Preparing Data for Analysis
Learn how to clean and prep data for analysis using spreadsheet tools and Python's Pandas.
-
42 minWorkshop
Data Visualization with Google Sheets
Did you know that Google Sheets is a great tool to tell stories with your data? This workshop will guide you through five different ways to visualize your data with Google Sheets and ultimately improve the story you're trying to tell to stakeholders!
Viewed -
16 minWorkshop
Presenting an Analysis
Learn the fundamentals for creating a presentation to highlight your analysis for stakeholders.
Viewed -
14 hoursConference
Treehouse Festival June 2021
Treehouse Festival is an online conference designed for Treehouse students and all aspiring developers and designers. The presentations will empower those that attend with skills and a network to transition to a tech career or level-up in their current roles. Sessions include “Designing with a Developer Mindset,” “Computer Science, Emulation, and the NES,” “Interview with a Treehouse Grad”, and more!
Viewed -
26 minWorkshop
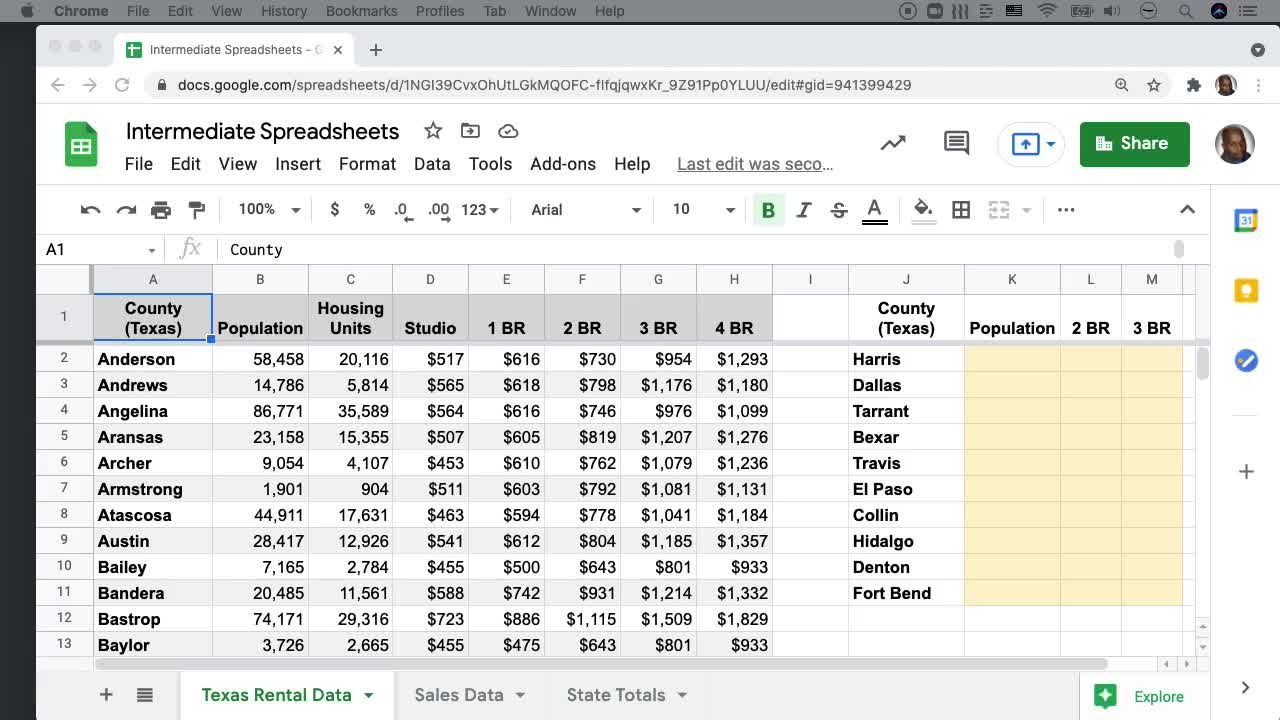
Intermediate Spreadsheets
Are you ready to learn more about working with spreadsheets? This workshop will explore concepts such as conditional formatting, lookup functions, pivot tables, and error checking using Google Sheets. Expand your toolset as a data analyst and take your spreadsheet game to the next level!
Viewed -
- 1
- 2
- 3
- 4
Data Visualization Foundations
What is data visualization? A simple answer might be something like the graphic representation of data. But to get a better understanding of what practitioners of data visualization do, let’s start with the term data. By data, I mean raw, unorganized facts and numbers. Practitioners of data visualization take raw, hard-to-grasp data and turn that data into information by providing context and a purpose.
-
45 minWorkshop
Combining Data for Analysis
In this workshop, students are introduced to common methods used to combine multiple datasets, specifically merge and concatenation. Students will use Pandas, a powerful data analysis tool built on top of Python. After completion, students are equipped to combine datasets for further analysis and manipulation.
Viewed -
- 1
Basic Statistics for Data Analysis
Basic statistics concepts learned through traditional schools may have been forgotten or not utilized for a long time. This course is to remind students how to calculate basic statistics, solidify understanding of the terminology, and determine which graphs might be most useful in displaying data.
-
- 1
- 2
Intro to Data Analysis
An introduction to the concepts, tools, and terms for data analysis.
-
- 1
- 2
- 3
- 4
- 5
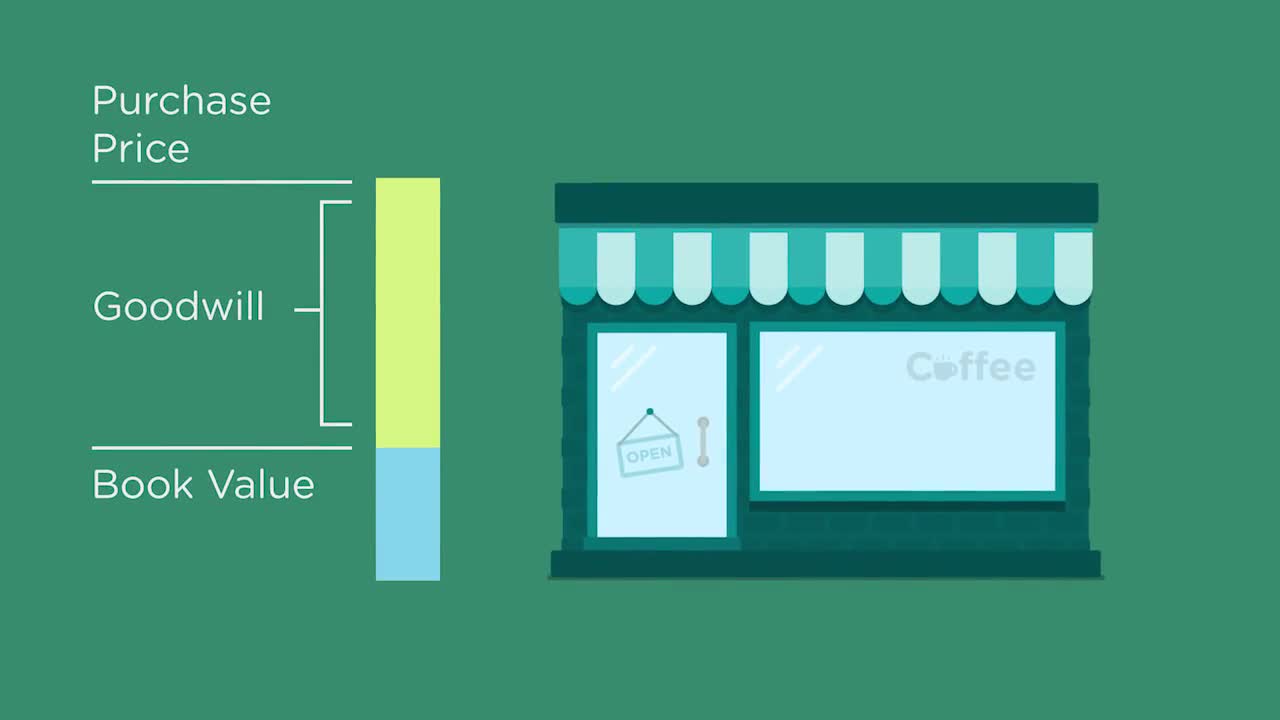
Financial Statement Basics
Understanding how to read the story that financial statements tell is a really useful skill and an important part of career development. In this course, we’ll give a basic overview of the 3 main financial statements: the Profit and Loss Statement, the Balance Sheet, and the Cash Flow Statement. We’ll teach what they show you, why it matters, and give you a bunch of practice problems to help retain that knowledge. After completing this course, you will be able to read, understand, and use financial statements and build on that knowledge as you continue to learn about them.
-
- 1
- 2
Introduction to Churn and Lifetime Value (LTV) Analysis
This introduction to Churn and Lifetime Value ("LTV") analysis course is designed for absolute beginners to give them exposure to the common business metrics of Churn and LTV. In the course we learn about recurring revenue, churn, LTV, why they matter, and navigate some of the nuances of the metrics.
-
- 1
- 2
- 3
- 4
Intermediate Excel
Learn how to perform intermediate level functions in Microsoft Excel. In this course, you will learn how to use LOOKUP functions, build and modify pivot tables, use conditional formatting, find and replace data, and check for errors. Learning these tools will help you bring data to life and allow you to use Excel in a more meaningful way.
-
- 1
- 2
- 3
Data Analysis Basics
Learn how to make better decisions with data in this course on data analysis. We'll start by looking at what data analysis is, and then we'll see how we can use data analysis to create better outcomes.
-
- 1
- 2
- 3
- 4
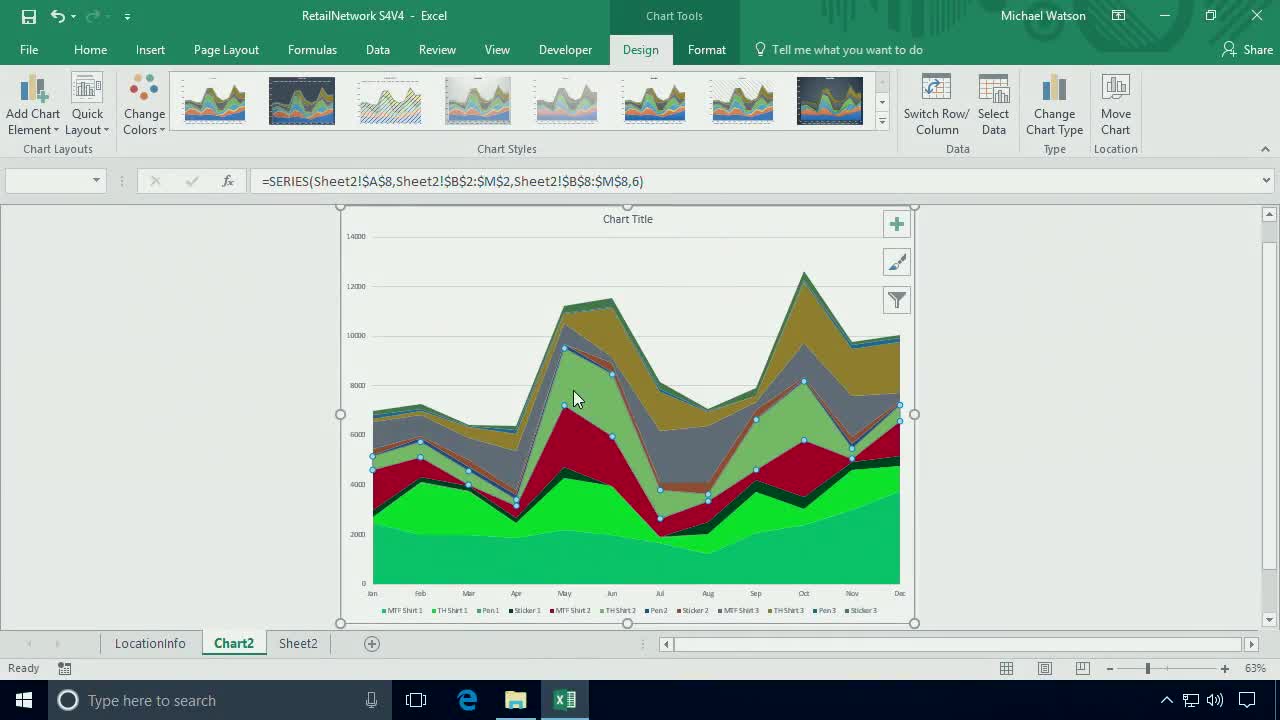
Data Visualization with Excel
This overview of Data Visualization in Excel is designed for absolute beginners, but can also benefit people who have already been using Excel to create charts. You will learn about the fundamentals of data visualization, how create types of charts in Excel, and tips on how to get the most of the charts you make.
-
- 1
- 2
- 3
Introduction to Big Data
Big data represents an entire ecosystem of data sets, tools, and applications. This course is intended to get you familiar with the concepts, problem spaces, and overall ecosystem of Big Data.
-
14 minWorkshop
Introducing Microsoft Excel
Take a quick tour of this popular spreadsheet software.
Viewed -
- 1
- 2
- 3
- 4
- 5
Spreadsheet Basics
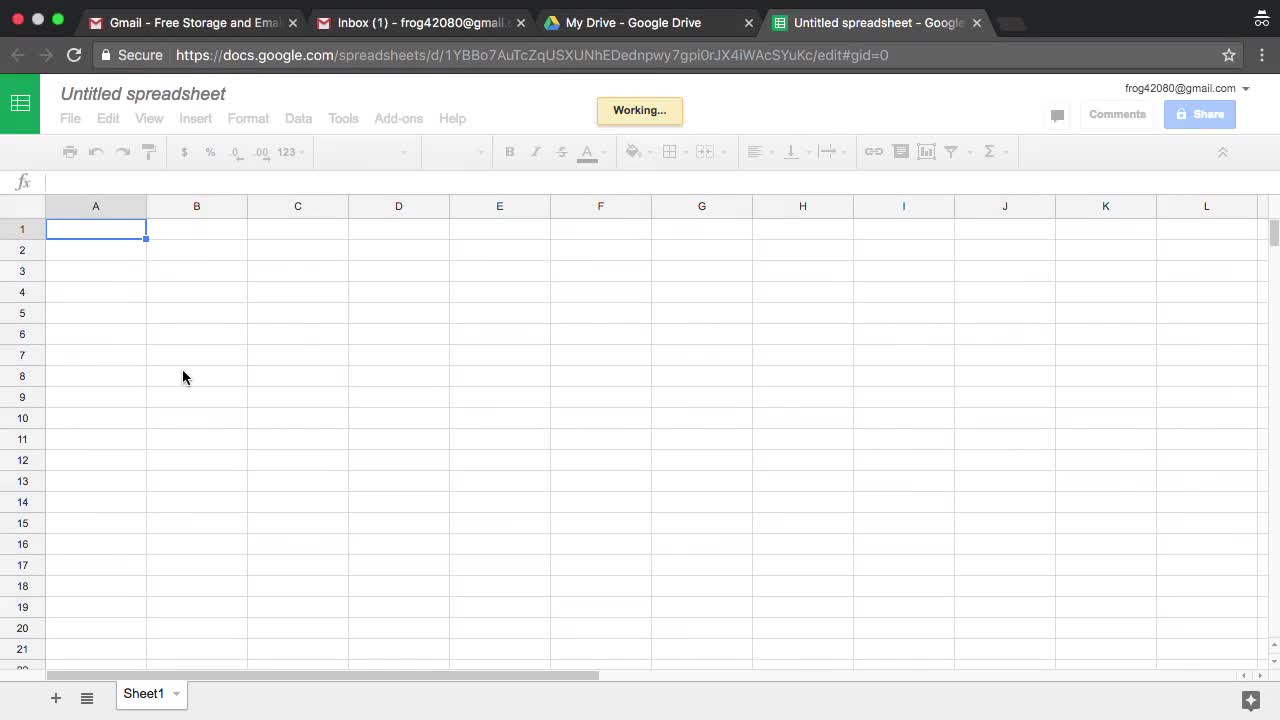
A spreadsheet is an electronic document that arranges data in a table by using columns and rows. Among other things, spreadsheets let you store, manipulate, share and analyze data. They're used in business to help make complicated decisions like where to open a new restaurant location, where to build a wind farm, or where to expand a business' marketing efforts. Spreadsheets aren't just for business use either. A household expense spreadsheet can help you determine when you will be able to afford a new car or take your next trip. In this course, you'll learn the basics of spreadsheets including the parts of a spreadsheet, spreadsheet vocabulary, how to import data, how to make complex calculations, how to reference data in different cells, and how to use spreadsheet functions. You'll also learn best practices for formatting spreadsheets, protecting your data, and more, all using Google Sheets, which is free and very similar to Excel. When you're done you'll have built an entire spreadsheet complete with data, complex functions and formulas and colorful and meaningful formatting.
Whoops! Perhaps you can try a broader search.